Full wavelength-calibration of spectra using night-sky emission lines
In some cases it is useful to obtain wavelength calibrations from the night-sky emission lines alone. Such cases include times when few or no arc-lamp spectra have been obtained (in order to maximise the amount of time spent on science target) or when you are dealing with a set of spectra taken over many nights and it would be very tedious to sort out (or even identify) appropriate arc spectra for each of your science spectra.
Strong emission lines are plentiful at wavelengths redder than about 6200 Å, but I have not yet tried this method on high-dispersion spectra so cannot guarantee it would be useful then (as the smaller wavelength coverage might mean that not many emission lines were present).
The method is essentially to use the sky spectra (which are calculated by pamela and subtracted from the science spectra) as surrogates for arc-lamp spectra. In my experience, the positions of the sky lines have a larger scatter than arc-lamp lines, but an equally reliable wavelength calibration can still be obtained because there are a large number of sky lines which can be used.

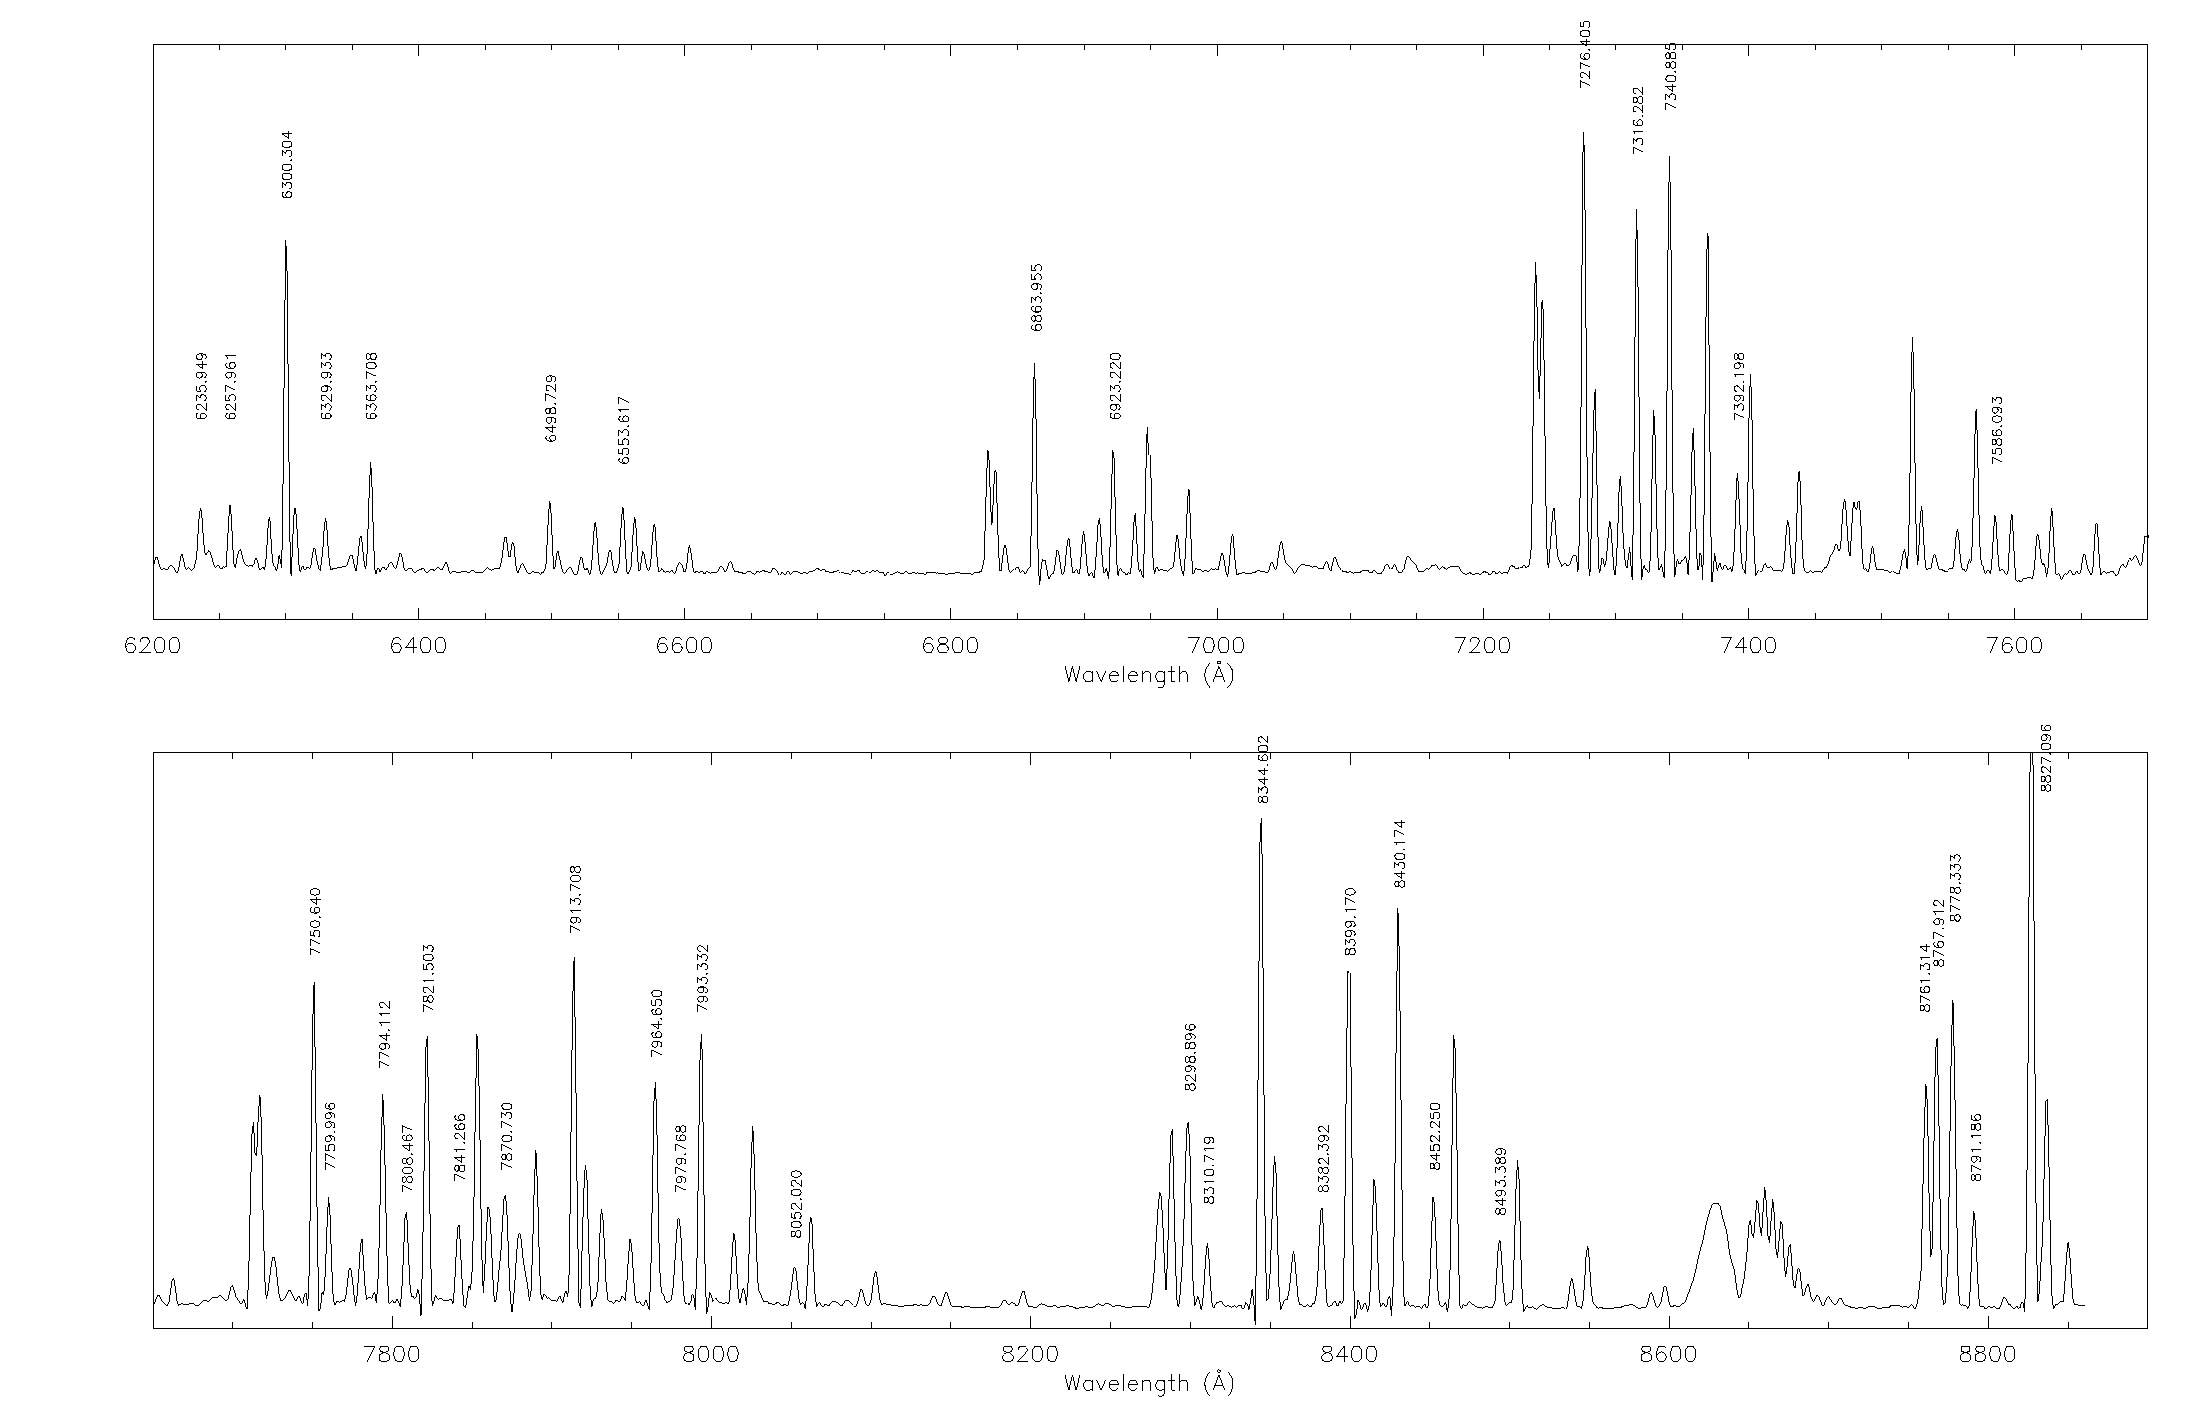
Here are two coarse maps which I have made of a sky spectrum I obtained covering 6000 to 8860 Å. Click on the images above to get the full-sized images. I have also made these into a pdf file for printing (note that these initially display upside-down for some reason).
Procedure
To perform a sky-line wavelength calibration then reduce the data as usual up to obtaining extracted science, sky and arc spectra. Then read in one of the sky spectra and construct a wavelength calibration using the same procedure as for a normal arc-lamp spectrum. For this you use the sky-line maps above and my list of sky line wavelengths (which currently covers mostly 7840 Å to 9570 Å but will soon be extended bluewards). A large number of additional wavelengths and high-resolution maps can be found in the papers listed in the Bibliography below. The most useful of these is Osterbrock et al (1996).
Once you have got a line list equating wavelength with pixel number (here called skylines.dat) you can apply it to each science spectrum with this script:
#!/bin/csh

molly << EOF
mxpix 3000 SURE
confirm
load skyo 1 1000 1
load opt  1001 2000 1
arc 1
abort
load
skylines.dat
fit
c
5
1000
m
CONFIRM
c
2
1000

load
skylines.dat
tweak
2

3
0

co
1 1000
0.5
q
write skyo 1 1000 n
acal 1001 2000 1 1000 N 1.0d6 1.0d6 600.0
write opt 1001 2000 n
clear 1 2000 sure
load skyn 1 1000 1
load nor  1001 2000 1
arc 1
abort
load
skylines.dat
fit
c
5
1000
m
CONFIRM
c
2
1000

load
skylines.dat
tweak
2

3
0

co
1 1000
0.5
q
write skyn 1 1000 n
acal 1001 2000 1 1000 N 1.0d6 1.0d6 600.0
write nor 1001 2000 n
q
y
EOF

exit
Bibliography
1992PASP..104...76O Osterbrock & Martel
Sky spectra at a light-polluted site and the use of atomic and OH sky emission lines for wavelength calibration
1996PASP..108..277O Osterbrock, Fulbright, Martel, Keane, Trager & Basri
Night-Sky High-Resolution Spectral Atlas of OH and O2 Emission Lines for Echelle Spectrograph Wavelength Calibration
1997PASP..109..614O Osterbrock, Fulbright & Bida
Night-Sky High-Resolution Spectral Atlas of OH Emission Lines for Echelle Spectrograph Wavelength Calibration. II.
2000PASP..112..733O Osterbrock, Waters, Barlow, Slanger & Cosby
Faint Emission Lines in the Blue and Red Spectral Regions of the Night Airglow
2003A+A...407.1157H Hanuschik
A flux-calibrated, high-resolution atlas of optical sky emission from UVES